To support discussions underway within the 2020 National Mitigation & Ecosystem Banking Conference — held online this year — EASI has updated its trend chart for U.S. wetland mitigation credit prices.
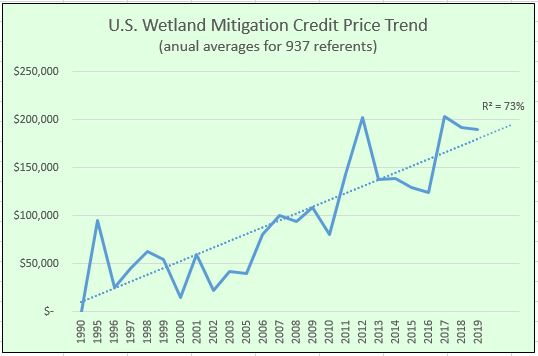
The new chart is based on nearly twice the number of Mitigation Credit Price Report referents (937 data points) that have now been gathered. The increasing number of referents has improved the ‘R-square’ statistical measure of the linear trend line. An R-square value is a measure of data fitness or data chart scatter. The higher the R-square value, the less data scatter, hence an improved confidence in the trend line.
A little more than halfway through 2020, we are seeing a 73% R2 value compared with a value of 59% for the previous chart that was based on 500 MCPR referents.
Since wetland credits dominate the mitigation banking industry, this chart illustrates continued strong demand for compensatory mitigation as a way to offset development impacts in the U.S.
Restoration of ecosystem services — protection of nature! — along with commitment of lands to permanent conservation could be the more important story resulting from this trend.
For more information about the MCPR click here. Or if you have questions about eco-asset values on your rural property, contact EASI here.